A high-grade zinc mining complex in New York State
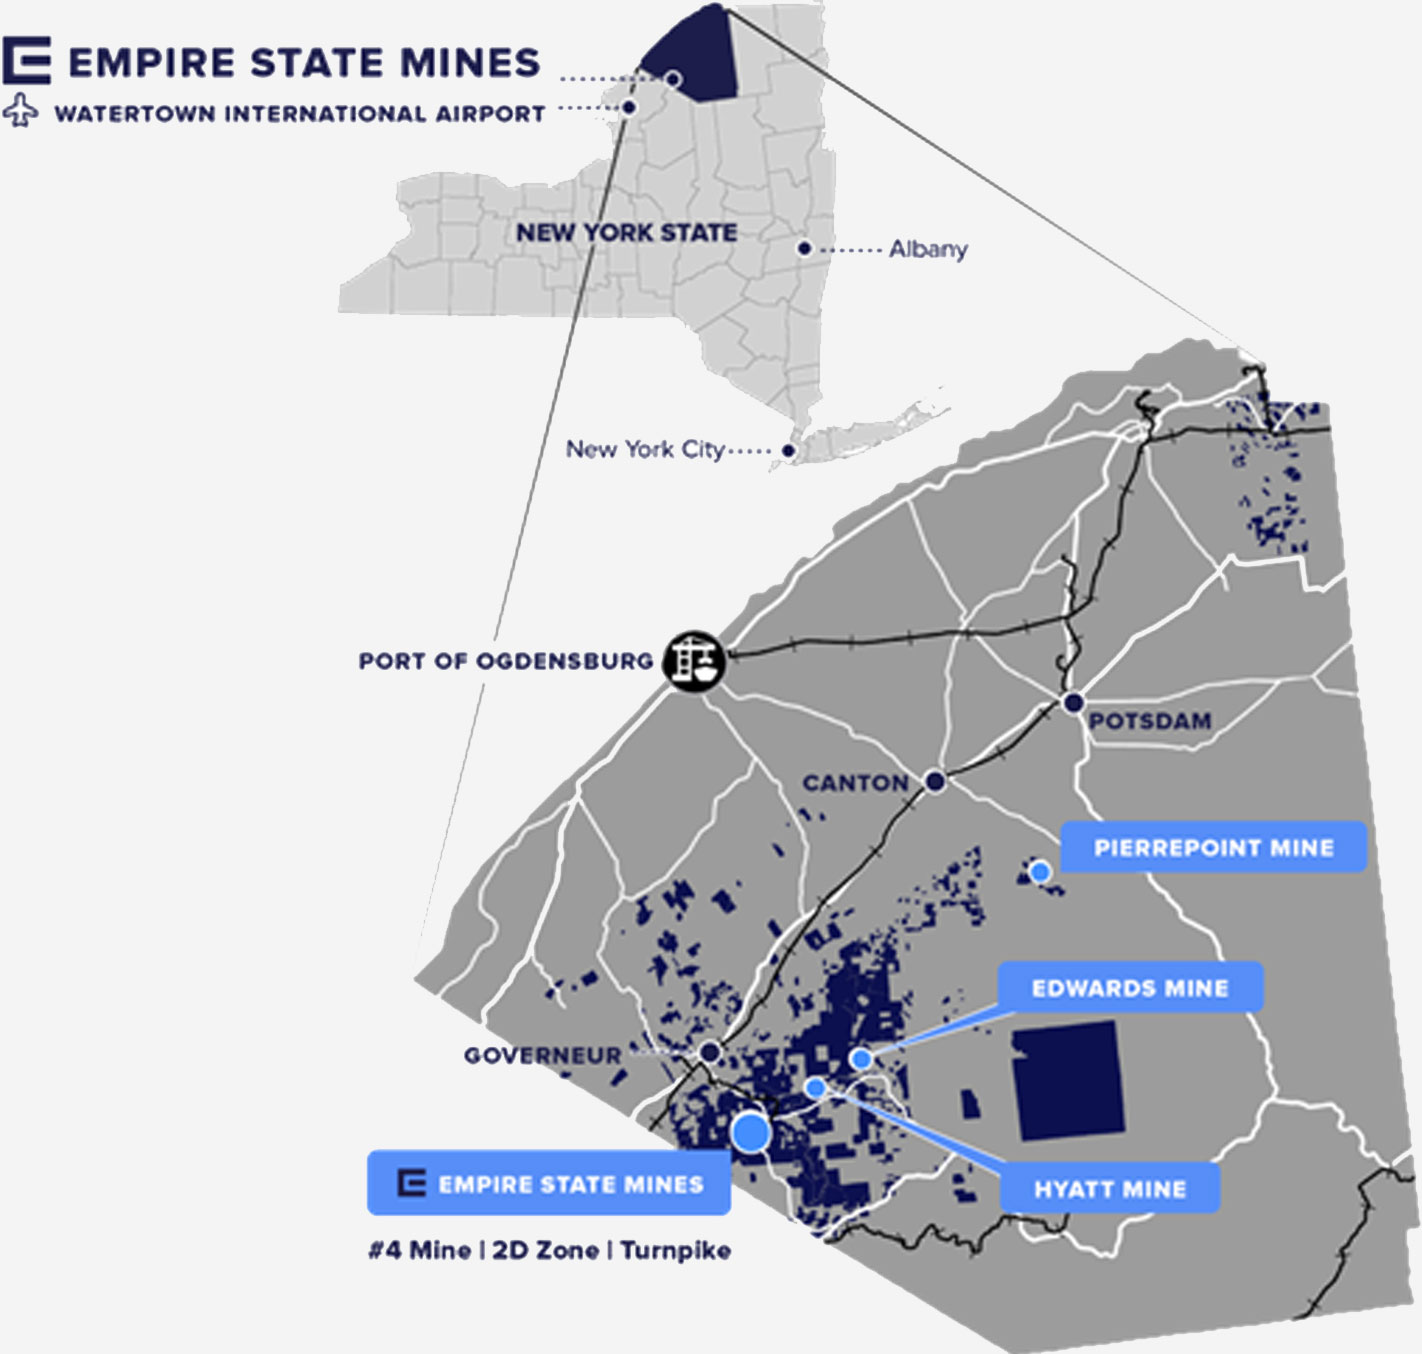
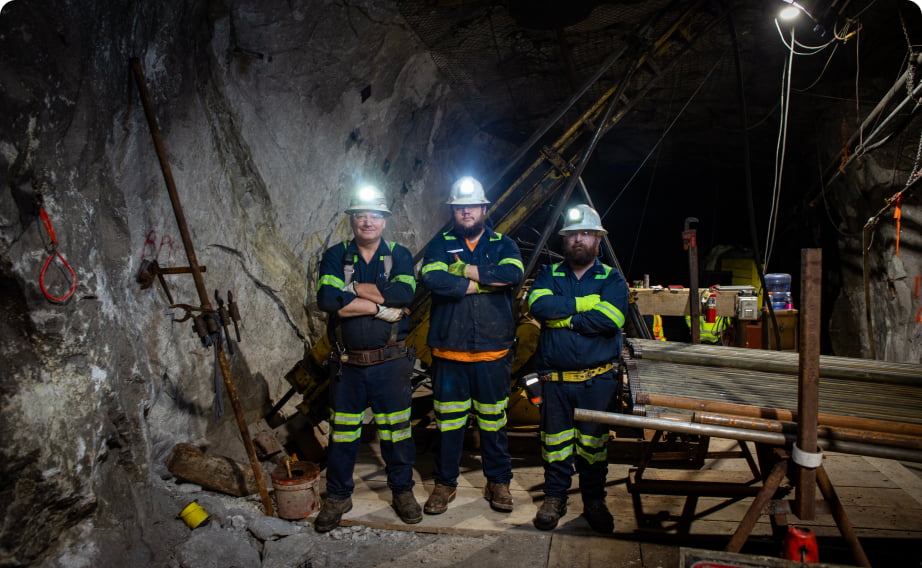
Our Zinc operations at ESM, comprise a group of high-grade operational mines in St. Lawrence County, New York State. ESM #4 mine which is in production, and six historic mines which have the ability to further feed our 5,000 tpd onsite mill. ESM #4 mine restarted mining operations in January 2018. The ESM #1, #2 and #3, Hyatt, Pierrepont and Edwards mines are all within a 30-mile radius of the 5,000 tons-per-day (tpd) mill.
Overview
Stage
Producing Operation
Location
Gouverneur, New York
Payable Production
FY 25 Guidance 64-69mlbs
Our Zinc operations are located 7 mi southeast of Gouverneur, New York. The site is 38 mi via State Road #812 from the St. Lawrence Seaway at Ogdensburg, NY. The town of Gouverneur is located 90 mi from Ottawa, Ontario, Canada, and is 100 mi northeast of Syracuse, New York.
2025F Guidance
Payable Production
64-69mlbs zinc
AISC
US$0.98-1.05/lb
Location & Infrastructure
Location, Access & Ownership:
ESM is located approximately 1.3 mi southwest of Fowler, New York State, in St. Lawrence County. We control more than 120,000 acres of mineral rights of which approximately 2,700 acres have both fee simple surface and mineral rights.
Infrastructure:
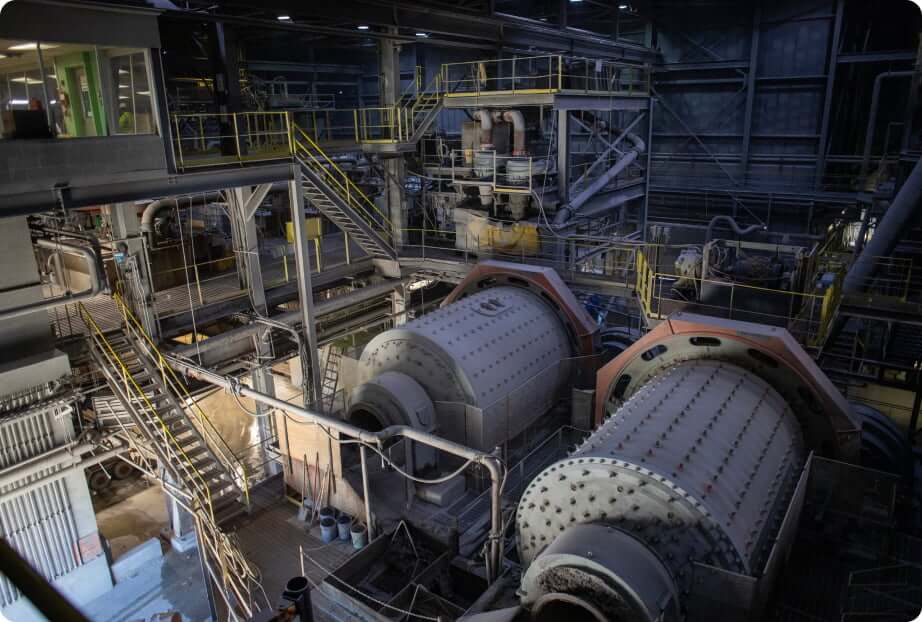
The mine is fully developed with shaft access and mobile equipment on-site. Existing surface facilities at the mine include a maintenance shop, offices, mine dry, primary crusher, mine ventilation fans, 12,000-ton (t) covered concentrate storage building, rail siding, warehouse, and storage buildings. The mine and its facilities were maintained to good standards during the period of care and maintenance.
The mine uses a combination of longhole stoping, inclined room and pillar style panel mining, and mechanized cut and fill as mining methods. An underground crusher is in place and is capable of feeding a surface flotation concentrator with name plate capacity of 5,000 tons per day (t/d). The mine plan scales up slightly from the current production rate of 1,750 t/d continuing through 2025 t/d to 2,000 t/d in 2029. The current mine life is projected to be 9 years.
Tailings are being placed in the existing permitted 260-acre conventional impoundment. The Tailings Management Facility (TMF) is categorized as a low-risk dam by the New York State Bureau of Flood Protection and Dam Safety.

LOM Highlights
On January 7, 2025 Titan released an updated Life of Mine Plan for the Empire State Mines1.
Zinc LOM Plan Update Summary
Table 1 presents the key metrics of the Zinc LOM Plan compared to the 2021 Zinc LOM Plan, considering the comparable periods from July 16, 2024 onwards (the effective date of the Zinc LOM Plan).
The total zinc production in the Zinc LOM Plan has increased by 35% compared to the 2021 LOM Plan. LOM throughput rate increased by 37% to 1,775 tons per day with total tons processed increased by 35% to 4.5mt over LOM.
Table 1: Summary of the Zinc LOM Plan and Comparison to the 2021 Zinc LOM Plan
| LOM Plan comparisons | Unit | LOM Plan | 2021 LOM Plan | Change | Change (%) (Net of Depletions) |
|---|---|---|---|---|---|
| Mine Life | Years | 9 | 7 | 2 | 29% |
| Resource Mined | kt | 4,469 | 3,309 | 1,160 | 35% |
| LOM Throughput Rate | t/d | 1,775 | 1,294 | 481 | 37% |
| Average Head Zinc Grade | % Zn | 7.4 | 6.6 | 0.8 | 12% |
| LOM Recovered Zinc | Mlbs | 636 | 470 | 166 | 35% |
| LOM Payable Zinc | Mlbs | 541 | 400 | 141 | 35% |
Table 2: Summary of Results
| Summary of Results | Unit | Value |
|---|---|---|
| Mine Life | Year | 9.0 |
| Resource Mined | kt | 4,469 |
| LOM Throughput Rate | t/d | 1,775 |
| LOM Operating Days per Year | d/y | 260 |
| Average Head Zinc Grade | % zn | 7.4 |
| LOM Recovered Zinc | M lb | 636 |
| LOM Payable Zinc | M lb | 541 |
| Total Revenue | $M | 577 |
| Total Offsite Charges | $M | 107 |
| Royalties | $M | 0.2 |
| NSR (net of royalties) | $M | 577 |
| Capital Costs (including sustaining) | $M | 27 |
| Operating Costs | $M | 446 |
| Operating Costs | $/t processed | 101 |
| Pre-tax Cash FLOW | $M | 104 |
| Taxes | $M | 5.6 |
| After-tax Cash Flow | $M | 98 |
| Pre-tax NPV (5% discount) | $M | 88 |
| After-tax NPV (5% discount) | $M | 83 |
Source: ESM 2024
The results disclosed herein are the results of a preliminary economic assessment. On this basis, it is considered preliminary in nature, it includes inferred mineral resources that are considered too speculative geologically to have the economic considerations applied to them that would enable them to be categorized as mineral reserves, and there is no certainty that the preliminary economic assessment will be realized.
Mineral Resources
2024 Zinc Mineral Resource Tables
Table 3: Underground Mineral Resource Estimate
| Classification | Tons (000’s US short tons) | Zn (%) | Contained pounds (Mlbs) |
|---|---|---|---|
| Measured | 295 | 17.1 | 101 |
| Indicated | 1,158 | 15.7 | 364 |
| Measured + Indicated | 1,453 | 16.0 | 465 |
| Inferred | 4,327 | 12.1 | 1,049 |
Source: ESM 2024
Notes:
- The qualified person for the 2024 Mineral Resource Estimate (“MRE”), as defined by National Instrument (“NI”) 43-101 guidelines, is Donald (Don) R. Taylor, of Titan Mining Corp., SME registered member (#4029597).
- Mineral Resources are not Mineral Reserves and do not have demonstrated economic viability. There is no certainty that any part of the Mineral Resources estimated will be converted into a Mineral Reserves Estimate.
- Three-dimensional (3D) wireframe models of mineralization were prepared in Leapfrog Geo based on the geological interpretation of the logged lithology on contiguous grade intervals defining mineralized sub-domains. The 2024 underground MRE encompasses 36 vein domains and 6 indicator RBF interpolant shells totaling 42 individual wireframes.
- Geological and block models for the underground MRE used data from a total of 1,100 surface and underground diamond drill holes (core). The drill hole database was validated prior to resource estimation and QA/QC checks were made using industry-standard control charts for blanks and commercial certified reference material inserted into assay batches by Empire State Mine personnel.
- High-grade capping was evaluated and implemented on the raw assay data on a per-zone basis using histograms and log-probability plots. Outliers were further evaluated during estimation and limited if necessary using the Leapfrog Edge clamping method.
- The MRE was compiled from 10 individual block models that were prepared using Leapfrog Edge. Block models were sub-blocked at domain boundaries and samples were composited using vein length intervals where a single composite is generated for each complete vein intersection with a drillhole. Composites were generated within the indicator RBF interpolant models as 10 foot run-length composites with residuals less than 5 feet added to the prior interval, honoring the modeled geological boundaries. Grade estimation was carried out using Inverse Distance Weighted (IDW) methods coupled with variably orientated search ellipses derived from modelled vein surfaces.
- The specific gravity (SG) assessment was carried out for all domains using measurements collected during the core logging process. Where there is sufficient sampling the SG is interpolated into model blocks using IDW techniques. If insufficient sampling exists then density was assigned to models based on calculated means or by a regression formula.
- Resources are reported using a 5.3% Zinc cut‑off grade, based on actual break-even mining, processing, G&A costs, and smelter terms from the ESM operation at a zinc recovery of 96.4%.
- Resources stated as in‑situ grade at a Zinc price of $1.30/lb.
- The resource classification considered the quality, quantity and distance to the data informing blocks in the model, as well as the geological continuity of the mineralized zones. Classification parameters vary slightly depending on the nature and continuity of the individual zones. Block classification was explicitly domained based on a calculation that used quality, quantity, and distance parameters.
- Quantities and grades in the MRE are rounded to an appropriate number of significant figures to reflect that they are estimations.
- The Mineral Resource Estimate was prepared following the CIM Estimation of Mineral Resources & Mineral Reserves Best Practice Guidelines (November 29, 2019).
- CIM definitions and guidelines for Mineral Resource Estimates have been followed.
- The effective date of the underground mineral estimate is July 16, 2024.
Exploration
Opportunities- Near Term Increase in Production and District Scale Potential
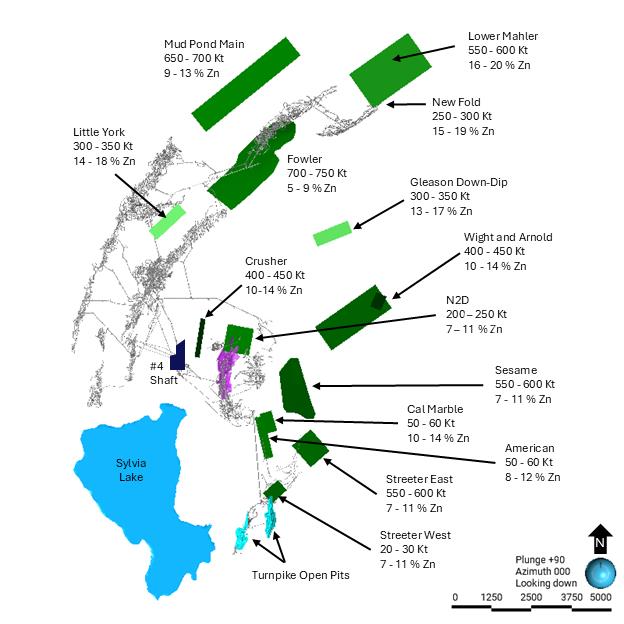
Titan is assessing near term production increase opportunities at Turnpike with N2D production increase underway. Accelerating mining of N2D and commencement of open pit mining at Turnpike could increase near term production, cash flows and project NPV over the life of the zones. Near mine exploration targets provide opportunities for resource expansion that could increase mine life and are summarized in Figure 1 below.
Figure 1- Near mine exploration and production opportunity targets
Targets for exploration drilling can be broken into three categories, near mine, within the Balmat (ESM #1-#4)-Pierrpont trend, and within the greater district. Figure 1 shows the current near mine drill targets.
In 2025, near mine exploration is expected to expand the Mahler, Mud Pond Main and New Fold zones with planned underground drilling totaling 40,000 ft and test Arnold Pit/White, Streeter East, Streeter West, and Little York with planned surface drilling totaling 13,000 ft.
Total near mine exploration target range is between 5.0mt-5.5mt at average zinc grades of 10-14% providing significant potential to increase mine life. The potential quantity and grade of these exploration targets was based on historic production figures of geologically similar horizons. The potential quantity and grade is conceptual in nature and there has been insufficient exploration to define a mineral resource at these targets. It is uncertain if further exploration will result in these targets being delineated as a mineral resource.
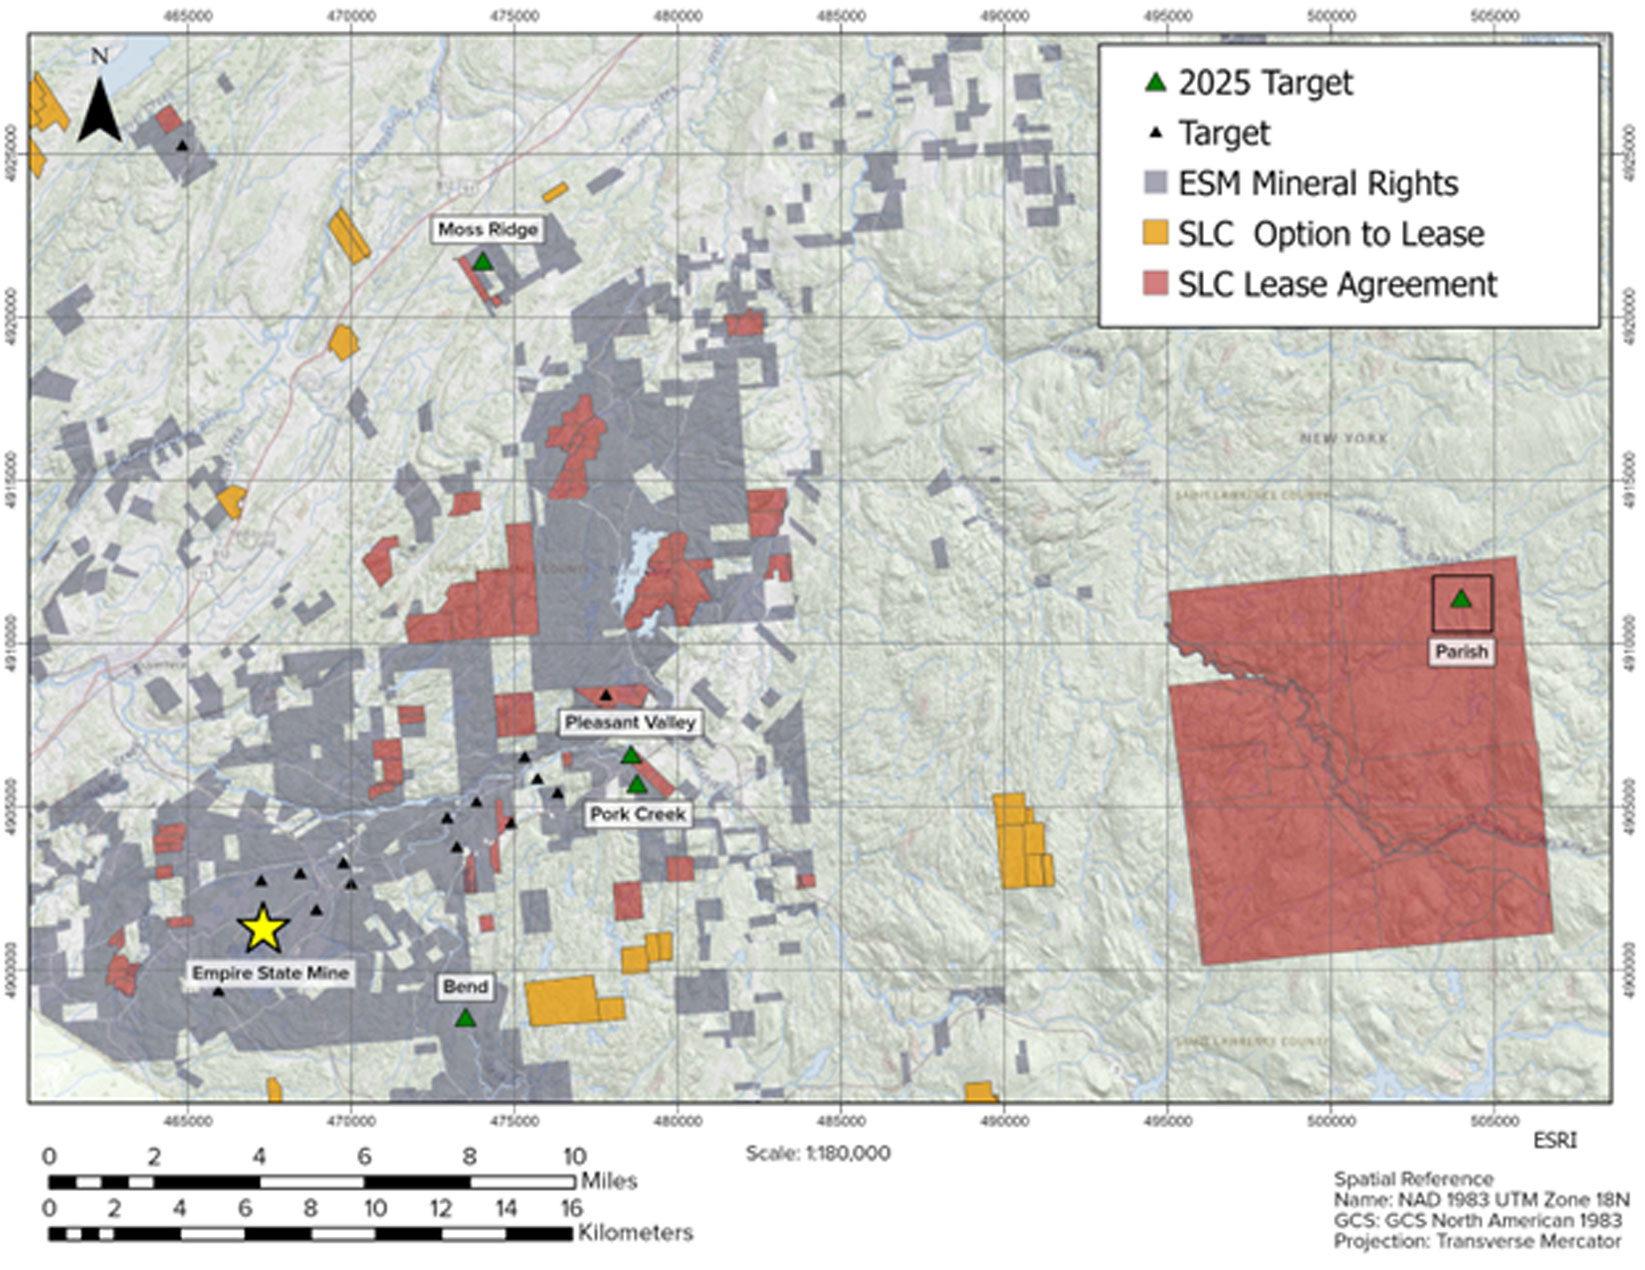
On May 8, 2025, the Company announced a co-operative agreement for the addition of 43,943 acres of mineral rights through lease and option agreements with St. Lawrence County, New York. This expansion brings Titan’s total mineral tenure in upstate New York to over 120,000 acres, increasing the discovery opportunities for additional zinc and graphite resources as well as iron-oxide copper gold ("IOCG") deposits.
The agreement results in the consolidation of the mineralized trend between ESM and the historic Edwards Mine (6,567,660 tons produced at 10.76% Zn). Properties added include the historic Clifton Magnetite Mine and Parish Magnetite occurrence to Titan’s portfolio. The Parish Prospect highlights the potential for IOCG mineralization within the historic Adirondack Magnetite Belt. Historic drilling at Parish has encountered copper sulfides and recent sampling returned surface gold values of 0.1–0.4 g/t Au. The added mineral parcels also include prospects for additional graphite mineralization as highlighted by Titan’s airborne geophysical surveys.
In addition to the near mine targets, the Company has developed an additional twenty drill ready zinc targets. Of these, fifteen are within the historic Balmat (ESM) – Pierrepont trend. Targeting has focused on: the extension of historic mineralized intercepts with room down dip, and along strike to accommodate a significant body of mineralization; testing historically productive stratigraphic units; and testing down dip from surficial zinc anomalies. Targets for the 2025 in trend drill program include Pleasant Valley, Pork Creek, and Bend (See Figure 2 below).
There are currently five drill ready zinc targets within the district. These target: the down dip extensions of zinc anomalies identified through surface geochemical sampling; stratigraphy with known past base metal production; and conceptual geologic and geophysical targets.
In addition to the zinc targets, there is also a polymetallic drill ready target within the mineral tenure. The Parish drilling will target the extents and geochemical composition of the historically documented magnetite ore body. The Company currently has 16,000 ft planned to test targets within the trend and district.
In addition to the 56,000 ft planned for the 2025 revised drill programs, the Company plans on collecting greater than 2,000 soil samples annually from its existing and future mineral tenure. This program will begin targeting historically productive stratigraphic units within the trend, and historic geochemical samples (rock and soil) with elevated Zn recorded. The Company’s 2022 soil program led to the development of the Pork Creek, and Moss Ridge drill targets.
Figure 2- District Drilling and Geochemical Sampling Targets
Technical Report
History
Management & Ownership
The ESM operation is wholly owned by Empire State Mines, LLC (“ESM”, formerly known as St. Lawrence Zinc Company, LLC), a subsidiary of Titan. A history of ownership is listed in the table below. Star Mountain Resources, Inc. purchased ESM from Hudbay in November of 2015.
On 30 December 2016, Titan US purchased the shares of Balmat Holding Corporation, which in turn holds the shares of ESM. Titan was a privately held company, which had ESM as its primary asset. Titan changed the name of the mine from Balmat to Empire State Mines in February 2017.
Exploration History
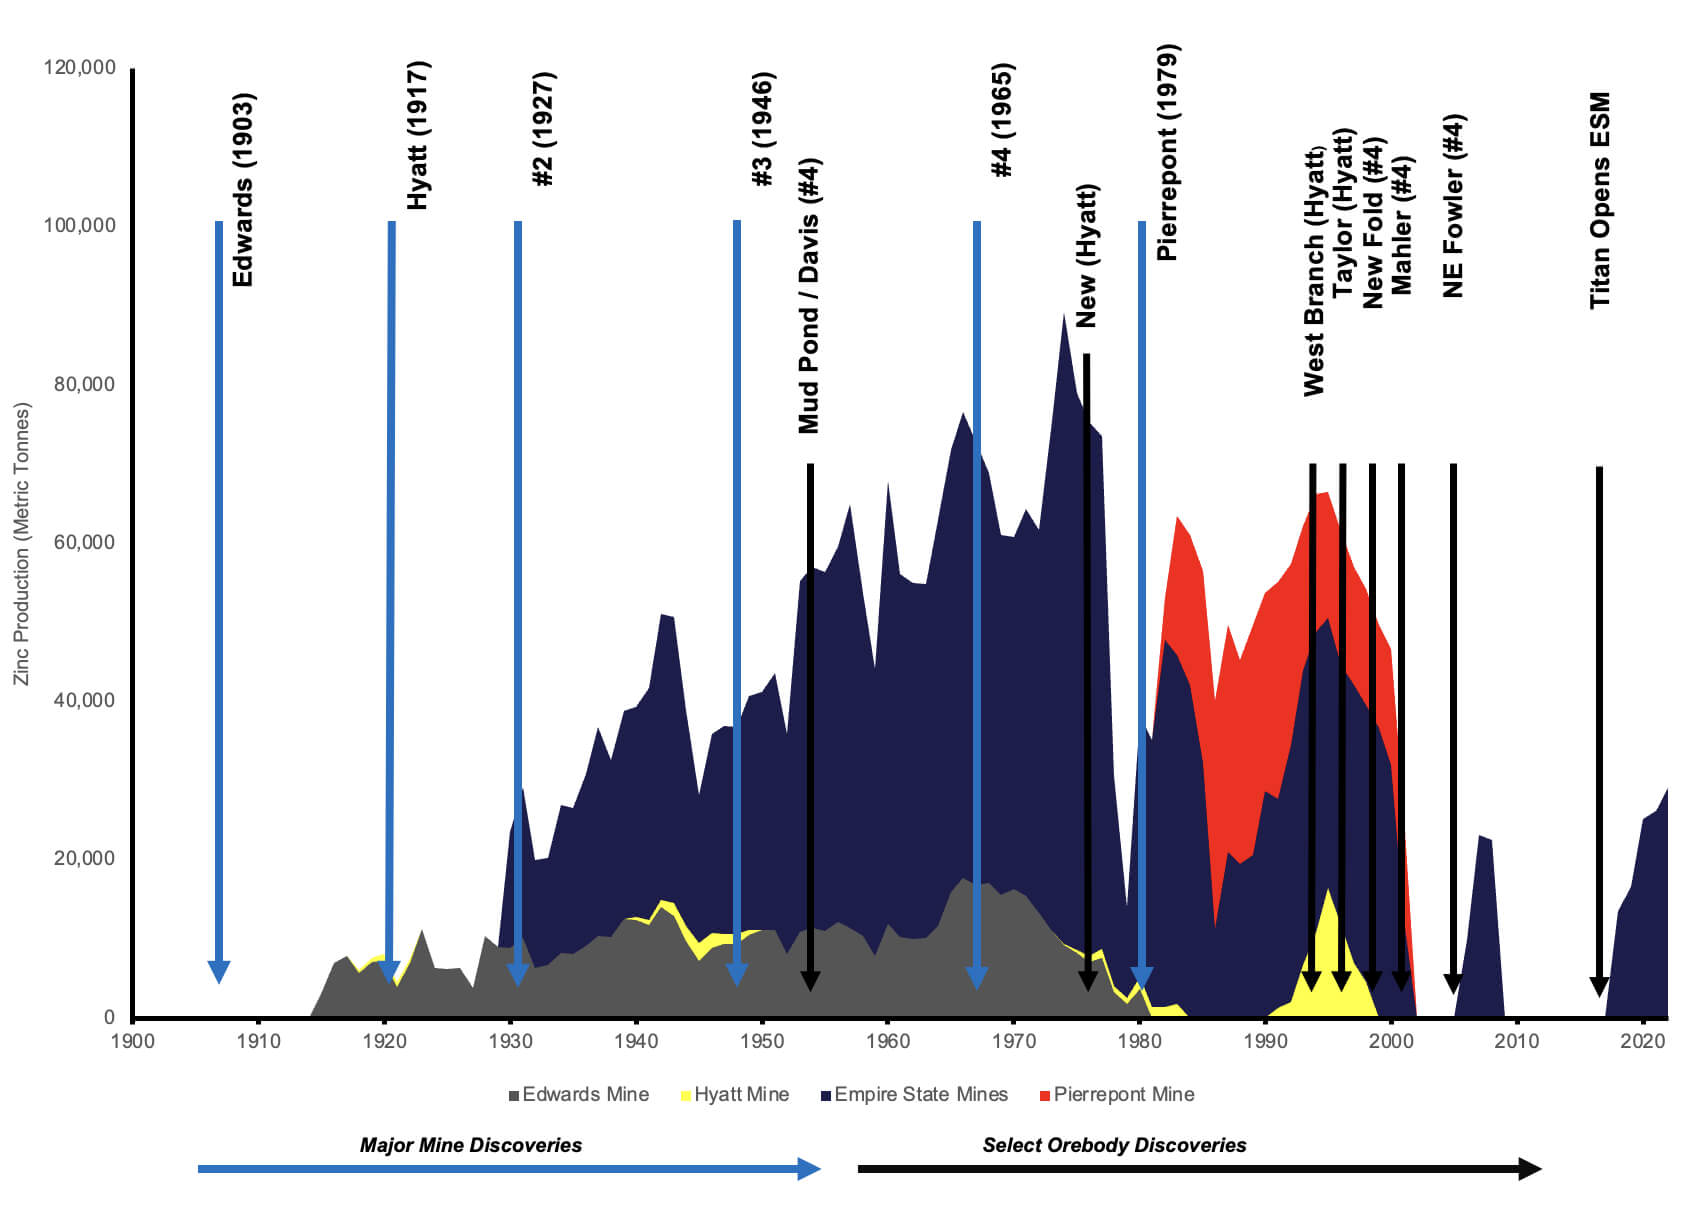
In 1838, zinc was discovered in a prospect pit on the Balmat farm, which is located near the current location of Balmat #1 shaft. Further zinc mineralization was discovered in the Balmat-Edwards-Pierrepont district from road excavations that was developed into the Edwards mine (1908) and Hyatt (1917) mine. Gossan was later recognized, and subsequent core drilling defined the Mineral Resources of the Balmat #2 Mine in 1928. In 1945, surface drilling, down-plunge from surface showings, intersected the Balmat #3 Mine Mineral Resources. A systematic fence-drilling program across the Sylvia Lake Syncline (perpendicular to the plunge) discovered the Mineral Resources of Balmat #4 Mine in 1965. In 1979, the Pierrepont mine was discovered while drilling down-plunge from geochemical anomalies. Mine development and exploration drilling added significant reserves to the Hyatt mine in 1994, and to the Balmat #4 Mine in 1996, with the expansion of the Mud Pond zone. The New Fold and Mahler resources were later discovered in the #4 Mine in 1997 and 2000.
The Balmat area has had an active mining history for the past 85 years. On average, during the period between 1908 (discovery of the Edwards mine) and 1979 (discovery of the Pierrepont mine), a mine was discovered every 17 to 18 years in the Balmat-Edwards-Pierrepont district.
Production History
Since 1915, several zinc mines have operated in the Balmat-Edwards-Pierrepont district, collectively now known as Empire State Mines, out of four mining camps. The mining camps are known as Balmat, Hyatt, Edwards, and Pierrepont. Mine access was primarily by shaft for both the Balmat and Edwards camps, and by portal for the Hyatt and Pierrepont camps. Shafts were added over the decades as mining deepened and additional discoveries were made. Zinc was first produced from the Edwards mine in 1915 and from the Balmat #2 Mine in 1930.
Mines were operated in the district by St. Joe Minerals Corporation (St. Joe Minerals) and its predecessors from 1915 to 1987. Zinc Corporation of America (ZCA) purchased the mines in 1987 and operated them until 2001, shutting down the Balmat operations when high grade feed from the Pierrepont mine was exhausted. In September 2003 OntZinc, renamed Hudbay in December 2004, purchased the idle Balmat assets. The Balmat #4 Mine re-opened in 2006 and operated into 2008. The mine was placed on care and maintenance in August 2008.
From 2006 to 2008, Hudbay mined 855,000 tons grading 7% zinc from the Davis, Mud Pond, Mahler, Fowler, Upper Fowler, and New Fold zones. The Balmat #2, #3, and #4 Mines have produced 33.8 Mt at 8.6% Zn since operations began in 1930. The greater Balmat-Edwards-Pierrepont district has produced more than 43 Mt of 9.4% Zinc during the 76 years of operation by St. Joe Minerals and its predecessor companies. This is based on the formal reserve estimation prepared in 2001 by ZCA.
The existing Balmat mill was constructed in 1971 by St. Joe Minerals and has a nameplate capacity of 5,000 t/d. The mill has processed mineralized material from the Hyatt, Pierrepont, and Balmat Mines. The Balmat #4 shaft is adjacent to the mill and accesses zinc mineralization from the 1300, 1700, 2100, 2500, and 3100 levels. All mine plan tons as summarised in the LOM will be hoisted from the 3100 level of the #4 shaft.
The table below summarises historic production totals by region:
| Region | Years Active | Tons | Grade (Zn%) | Zinc (lb)* |
|---|---|---|---|---|
| Balmat | 1930-2001 2006-2008 2018-2023 |
36,029,247 | 8.59 | 6,186,537,996 |
| Hyatt | 1918-1922 1940-1949 1974-1983 1991-1998 |
1,205,526 | 8.24 | 198,695,031 |
| Edwards | 1915-1980 | 6,567,660 | 10.76 | 1,413,569,361 |
| Pierrepont | 1982-2001 | 2,657,527 | 16.29 | 865,686,479 |
| Total | 46,459,960 | 9.32 | 8,664,488,867 |
Source: ESM 2024
*Zinc pounds are theoretical pounds hoisted and not actual mill production totals.
The Empire States Mines annual production totals are as below:
| Year | Balmat #4 Mine | Concentrate Produced | ||
|---|---|---|---|---|
| Tons | Grade (Zn%) | Tons | Grade (Zn%) | |
| 2018 | 187,854 | 7.94 | 23,932 | 58.19 |
| 2019 | 218,823 | 8.33 | 29,924 | 58.74 |
| 2020 | 323,414 | 8.58 | 45,161 | 59.35 |
| 2021 | 387,438 | 7.47 | 47,065 | 59.35 |
| 2022 | 425,022 | 7.54 | 52,547 | 58.79 |
| 2023 | 445,803 | 8.36 | 60,145 | 59.64 |
Source: ESM 2024
Historical Mineral Reserves
A list of the most recent Mineral Reserve estimates is presented in the table below. Hudbay’s Reserve estimates concluded in 2008, with the 2015 reserves prepared by Star Mountain Resources. ESM is not treating these historical estimates as a current Mineral Reserve. The QPs are unaware of the methods, parameters or assumptions used to generate these historic estimates and cannot comment to their accuracy.
| Year | Proven | Probable | Proven and Probable | |||
|---|---|---|---|---|---|---|
| Mass (000's tons) | Zn grade | Mass (000's tons) | Zn grade | Mass (000's tons) | Zn grade | |
| 1985 | 1,159 | 11.52% | 598 | 9.81% | 1,758 | 10.94% |
| 2005 | 686 | 10.60% | 1,023 | 11.40% | 1,709 | 11.00% |
| 2006 | 912 | 10.10% | 1,163 | 11.40% | 2,075 | 10.80% |
| 2007 | 1,000 | 9.50% | 890 | 10.80% | 1,891 | 10.20% |
| 2015 | 152 | 9.00% | 394 | 9.20% | 531 | 9.20% |
Source: SLZ 1985, Hudbay 2005-2009, Star Mountain 2015
ESM continues to believe that the history of exploration successes is likely to have potential for additional discoveries. Many discoveries were made during a century of mining operations. There has been minimal exploration during 2000-2010 period. The district remains highly prospective and ESM is refocussing on exploration concurrent with production.
Long production history with numerous discoveries
The scientific and technical information contained herein was based upon the technical report titled "Empire State Mines 2024 NI 43-101 Technical Report Update Gouverneur, New York, USA" (the "ESM Technical Report") which has an effective date of December 3, 2024, and was approved by the following qualified persons: Donald R. Taylor, MSc., PG, Todd McCracken, P. Geo., Deepak Malhotra, P. Eng., and Oliver Peters, MSc, P. Eng., MBA. Mr. Taylor is the Chief Executive Officer of the Company. Messrs McCracken, Malhotra, and Peters are independent of the Company. Any subsequent exploration information is as referenced in the Company’s relevant press releases and approved by relevant personnel noted therein.


