Targeting to be the first commercial producer of US sourced and processed graphite
The Kilbourne deposit was discovered by ESM in 2023. The deposit comprises of an open pit constrained inferred resource of 22 million tons at an average grade of 2.91% Cg with 653kt of contained graphite. Nearly all of the existing resource is within the active use permit, with only permits required to bring to production comprising of state permits
Key Metrics
Inferred Resource
Open Pit 22mt@2.91% (Cg) containing 653kt of contained graphite
Metallurgy
91.0% processing recovery and a concentrate grade of 95.0%
Selling Price Assumption
$1090/t of concentrate
Overview
Mineral Resource
On December 3, 2024 Titan released the maiden mineral resource estimate for Kilbourne. This outlined an open-pit constrained inferred mineral resource estimate of 22 million US short tons (“tons”) at an average grade of 2.91% (Cg) containing 653,000 tons of graphite, based on a cut-off grade of 1.50%.
The maiden mineral resource estimate based on 45 diamond drill holes totaling 29,699 ft completed as Phase I drilling. The Phase 1 drilling and maiden mineral resource estimate represents a small subset of the total graphite bearing unit identified through surface mapping and historical drilling.
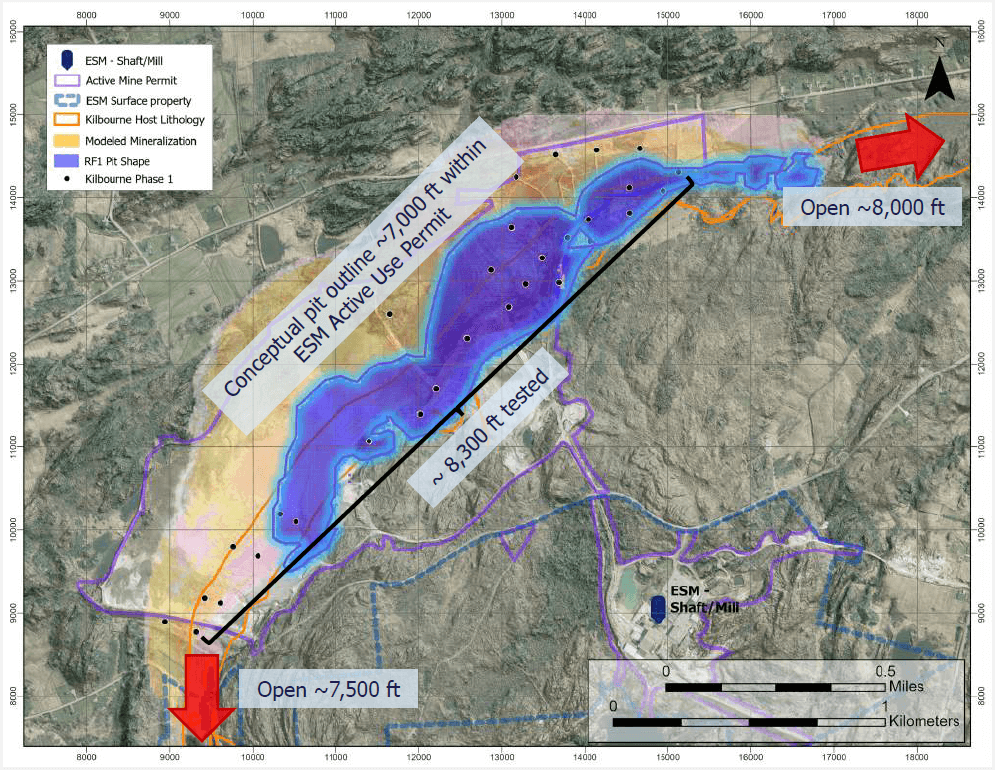
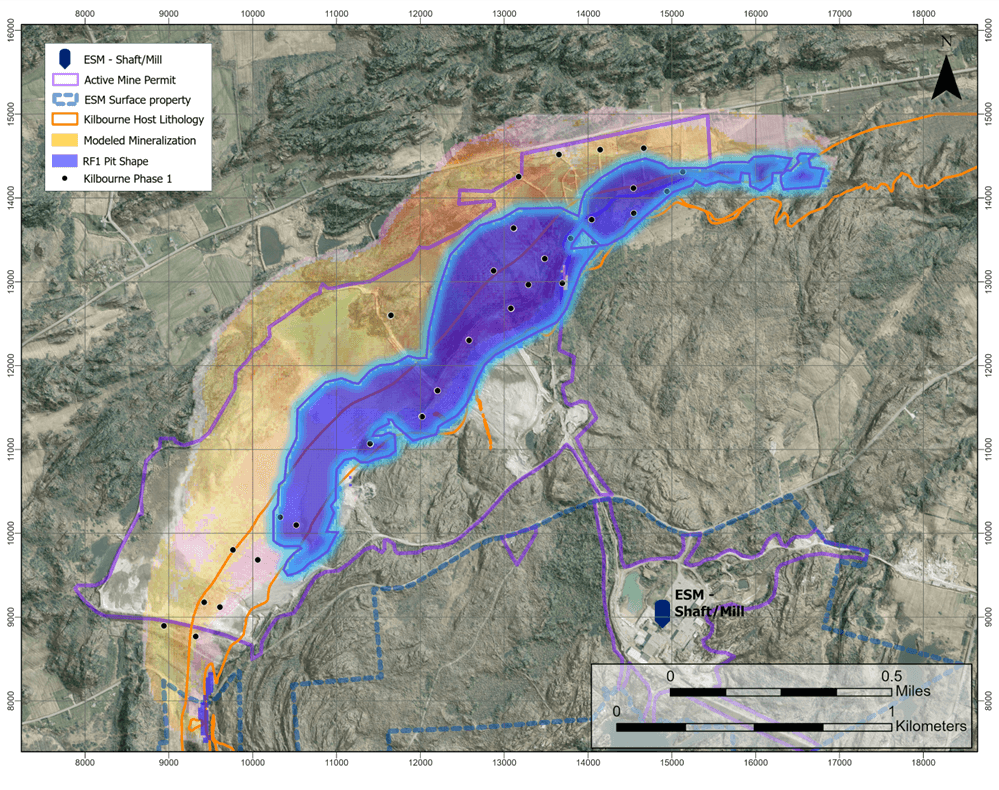
Figure 1: Kilbourne conceptual pit outline with modeled mineralization and Titan property and permitting outlines
Table 1: Kilbourne Graphite Mineral Resource Summary and in-situ Metal within Pit Shell
| Classification | Deposit | Cut-Off Grade (% Cg) |
Tonnage (‘000 Ton) |
Grade (% Cg) |
Contained Graphite (‘000 Ton) |
|---|---|---|---|---|---|
| Inferred | Kilbourne | 1.50 | 22,423 | 2.91 | 653 |
Source: BBA USA Inc., 2024.
Notes:
- The independent Qualified Person for the Mineral Resource Estimate, as defined by NI 43-101 is Mr. Todd McCracken (PGO 0631) of BBA USA Inc. The effective date of this Mineral Resource Estimate is December 3, 2024.
- Three-dimensional (3D) wireframe models of mineralization were based on the geological interpretation of the logged lithology and sub-domained based on contiguous grade intervals greater than or less than 0.50% Cg defining two mineralized sub-domains.
- Geological and block models for the Mineral Resource Estimate used data from a total of 45 surface diamond drill holes (core) and 1 surface channel sample. The drill hole database was validated prior to mineral resource estimation and QA/QC checks were made using industry-standard control charts for blanks and commercial certified reference material inserted into assay batches by Empire State Mine personnel.
- Quantities and grades in the Mineral Resource Estimate are rounded to an appropriate number of significant figures to reflect that they are estimations.
- The mineral resource estimate was constrained using the following optimization parameters, as agreed upon by Empire State Mine and the QP. The parameters include mining costs of $4.60/ton for mineralized rock, $3.50/ton for unmineralized rock, and $2.00/ton for overburden and tailings, with a 5.0% dilution and 95.0% mining recovery. Processing costs are $14.00/ton milled, with a 91.0% processing recovery and a concentrate grade of 95.0%. No general and administrative (G&A) costs were applied. The selling price is $1,090/ton of concentrate, with transportation costs of $50/ton and no additional selling costs. The overall slope angles are 23 degrees for overburden and tailings, and 45 degrees for rock.
- Process recovery estimates based on Phase I testing done at SGS Lakefield and Forte Dynamics, open circuit recovery 86.5% with expected increase to 90-91% in closed circuit.
- The reported mineral resource estimate has been tabulated in terms of a pit-constrained cut-off value of 1.50% Cg.
- The block model was prepared using Datamine Studio RM™. A 30 ft x 30 ft x 15 ft block model was created, and samples were composited at 5.00 ft intervals. Grade estimation for graphite used data from drill hole data and was carried out using Ordinary Kriging (OK), Inverse Distance Squared (ID 2), and Nearest Neighbor (NN) methods. The OK methodology is the method used to report the mineral estimate statement.
- Grade estimation was validated by comparison of the global mean block grades for OK, ID2, and NN by domain and composite mean grades by domain, swath plot analysis, and by visual inspection of the assay data, block model, and grade shells in cross-sections.
- The specific gravity (SG) assessment was carried out for all domains using measurements collected during the core logging process. The mean specific gravity value within the mineralized domains is 2.75.
- The Mineral Resource Estimate was prepared following the CIM Estimation of Mineral Resources & Mineral Reserves Best Practice Guidelines (November 29, 2019).
Sensitivity Analysis
The results of grade sensitivity analysis are presented in Figure 2 to illustrate the continuity of the grade estimates at various cut-off increments and the sensitivity of the mineralization to changes in cut-off grade. The reader is cautioned that figures in the following chart should not be misconstrued as Mineral Resources or confused with the Mineral Resource Statement reported above. These figures are only presented to show the sensitivity of the block model estimated grades and tonnages to the selection of cut-off grade. Cut-off at the Kilbourne Graphite Project was set at 1.50% (Cg).
Figure 2: Kilbourne Graphite: Revenue Factor Sensitivity
Source: BBA USA Inc., 2024.
Table 2: Kilbourne Graphite Revenue Factor Sensitivity
| $USD per Ton Concentrate |
RF | Graphite [%] |
Mill Feed [k Ton] |
Contained Graphite [k Ton] |
Waste [k Ton] |
Overburden [k Ton] |
|---|---|---|---|---|---|---|
| 872.00 | 0.80 | 3.30 | 7,198 | 238 | 4,810 | 3,532 |
| 926.50 | 0.85 | 3.19 | 10,627 | 339 | 9,247 | 5,763 |
| 981.00 | 0.90 | 3.05 | 14,987 | 457 | 13,578 | 9,261 |
| 1035.50 | 0.95 | 2.99 | 18,303 | 547 | 18,824 | 11,072 |
| 1090.00 | 1.00 | 2.91 | 22,423 | 653 | 25,278 | 13,425 |
| 1144.50 | 1.05 | 2.86 | 25,109 | 719 | 29,871 | 14,557 |
| 1199.00 | 1.10 | 2.81 | 28,790 | 808 | 36,399 | 16,528 |
| 1253.50 | 1.15 | 2.76 | 32,401 | 895 | 44,365 | 18,400 |
| 1308.00 | 1.20 | 2.73 | 36,959 | 1,009 | 56,969 | 21,433 |
Source: BBA USA Inc., 2024.
Note: RF is a reference to Revenue Factor.
Metallurgy
Three phases of metallurgy were completed. Process optimization completed in Q4 2024 at SGS Lakefield for master composites and variability composites.
Master & variability composite head grades
- 118 mineralized intervals from 4 drill holes- 4 variability samples
- Sub-samples of all 118 drill core intervals were combined to produce a Master composite
- Final master composite test produced final concentrate of 98.8% C(t) and open circuit graphite recovery of 87.3%, 90-91% closed circuit recovery projected
Flow sheet and size fraction analysis
- Simplified flow sheet developed based on process optimization. Concentrate grades range between 97.6% C(t) for the North Shallow and 99.3% C(t) for the South Deep Composite
- Size fraction analysis demonstrates saleable product and key product group applications with US domestic customer base
Phase III Results (SGS)(1)
| Assays (%) | ||
|---|---|---|
| Composite | C(t) | C(g) |
| Master | 3.48 | 3.14 |
| North Shallow | 3.38 | 3.21 |
| South Shallow | 3.51 | 3.28 |
| North Deep | 2.87 | 2.68 |
| South deep | 3.57 | 3.25 |
| Concentrate Size Fraction- Master Composite | Mass % | Assays % C(t)(2) |
|---|---|---|
| +100 mesh | 8.2% | 98.1% |
| +150 mesh | 11.7% | 98.9% |
| +200 mesh | 26.0% | 99.1% |
| -200 mesh | 54.1% | 99.2% |
| Total Concentrate | 100% | 99.1% |
Notes:
- SFA analysis from Phase III metallurgy at SGS.
- SGS has reported concentrate assay results in total carbon (C(t)), the inference is that this represents graphitic carbon in a high-grade concentrate
Further Potential for Growth
The Company is planning Phase II drilling at Kilbourne, with a projected start date in H1 2025. The primary goal of the program is to raise mineral resource confidence from Inferred to Measured/Indicated status within the core of the Kilbourne mineral resource area. Drilling will also aim to extend zones of high-grade mineralization, and test the extensions of mineralization along strike, and down dip. Phase II will consist of an additional 12,000 ft of drilling.
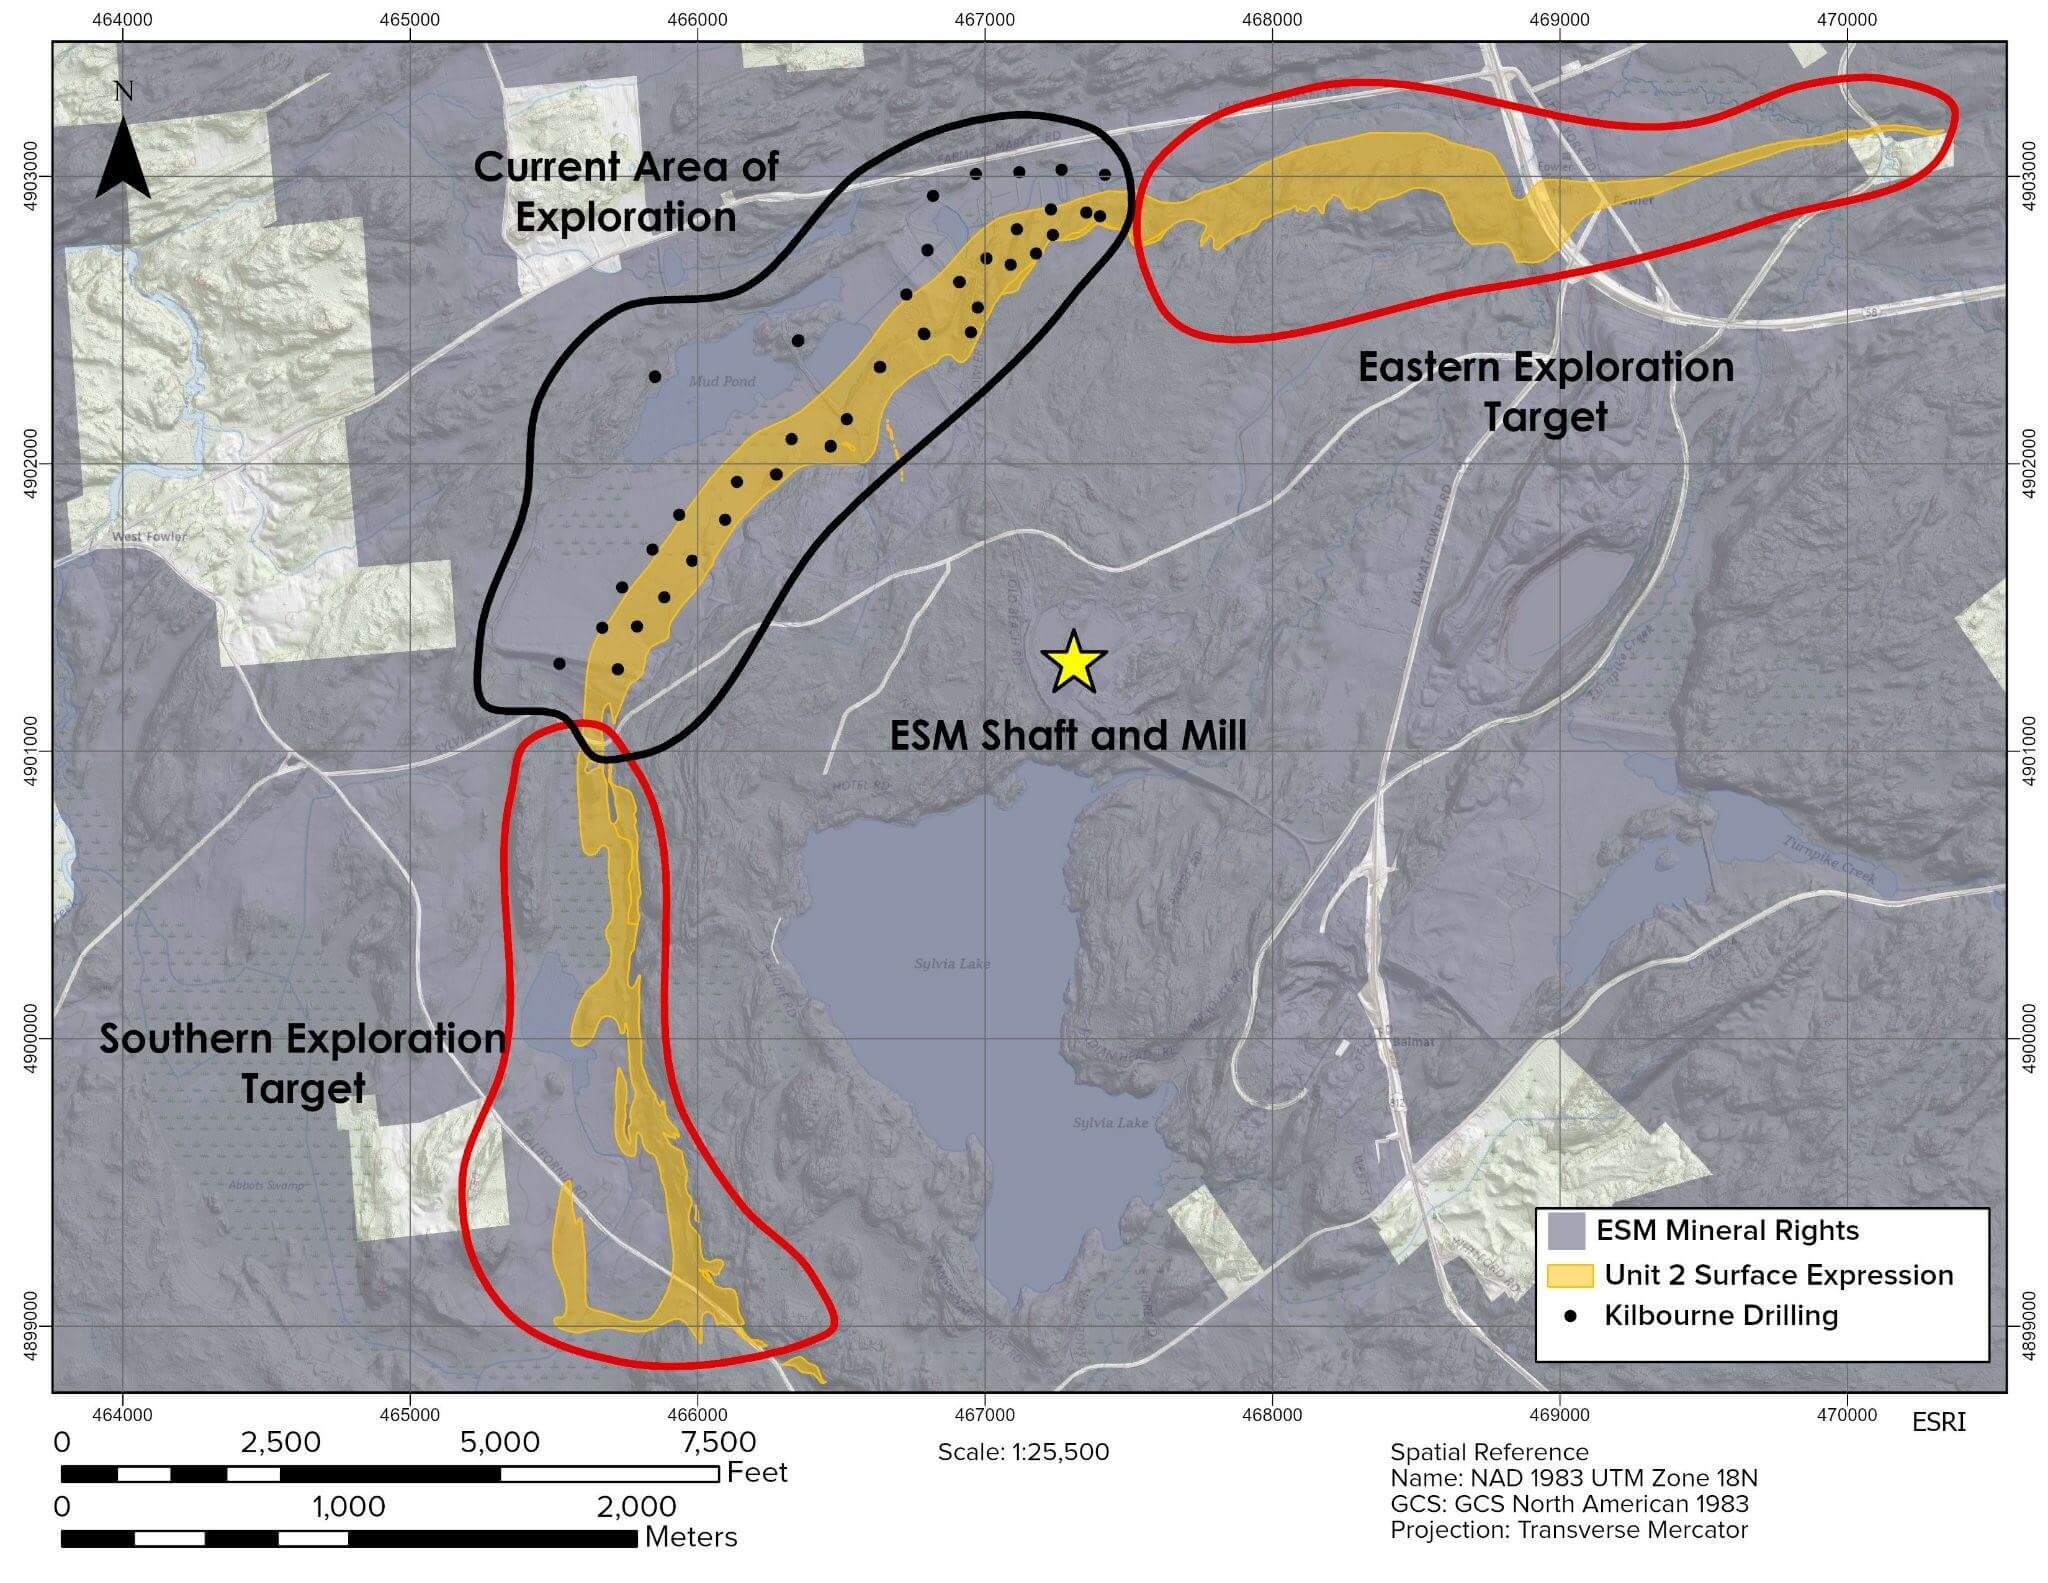
Phase I of drilling successfully tested roughly 8,250 ft of Kilbourne strike length. The Company holds mineral rights on over 15,000 ft of additional Unit 2 strike length. This includes 8,000 ft to the east, and 7,500 ft to the south. Historic drilling and surface mapping documents graphite mineralization, however there are no historic assays to confirm these observations. To date, a little over 30% of the Kilbourne trend has been tested with drilling. Exploration planning is underway to further test these extensions.
Exploration
Exploration Potential
Kilbourne Extensions
- The Company has tested roughly one-third of known Kilbourne strike length
- Southern Exploration Target - Mapped at surface for an additional 7,500 ft with multiple fold structures recorded
- Eastern Exploration Target - Mapped at surface an additional 8,000 ft, historic drilling indicates thickened untested Unit 2
District Targeting
- Historic geophysical targets identified for future testing
- Further reprocessing
- Follow up on historically logged graphitic intervals within drill database
The figure below shows the current exploration area, with the Southern and Eastern exploration areas highlighted.
Key Production Applications & Development Timeline
Key Product Applications
Selling Price Assumptions and Profitability
- The mineral resource for Kilbourne assumes a selling price of $1090/t of concentrate
- The selling price is based on conservative/low-case target market of industrial and lubricant use with no value-add products considered
- Significant resource upside from minimal pricing increase from sales to engineered products, energy storage and battery products segments
- In order to formalize demand and establish the pathway to commercialization Titan has announced the launch of a processing facility (the “Facility”), producing 1,000-1,200 tpa of graphite concentrate. The facility is expected to commence in H2 2025. This is expected to de-risk commercialization through (i) product qualification for higher value segments and (ii) establishing base line US domestic customers within traditional markets
The Facility will make Titan the first producer of US mined and produced graphite.
The key North American Domestic Market Groups being targeted by Titan are as below:
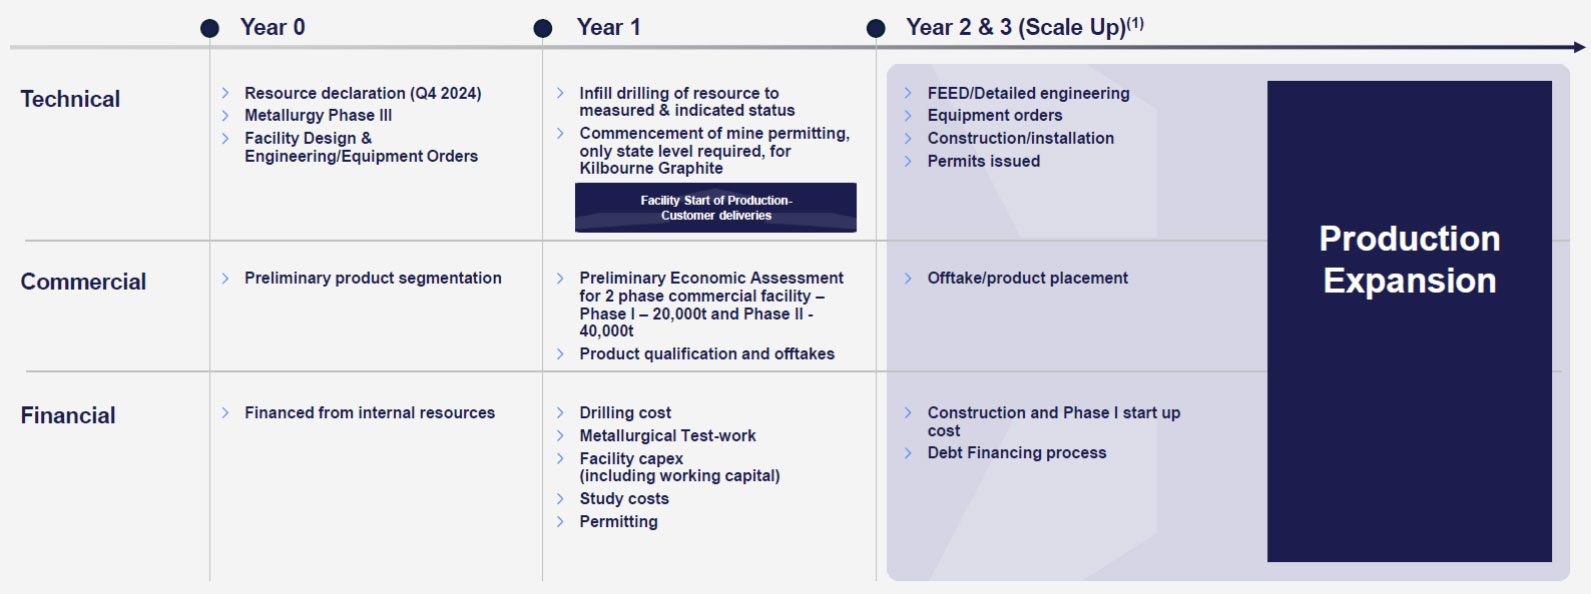
Development Timeline:
Next steps for the Kilbourne Graphite project are as included in the timeline below:
Note: Commercial production decision to be based on positive results through the Company's development plan, board approval, and financing
The scientific and technical information contained herein was based upon: 1. the technical report titled "Empire State Mines 2024 NI 43-101 Technical Report Update Gouverneur, New York, USA" (the "ESM Technical Report") which has an effective date of December 3, 2024, and was approved by the following qualified persons: Donald R. Taylor, MSc., PG, Todd McCracken, P. Geo., Deepak Malhotra, P. Eng., and Oliver Peters, MSc, P. Eng., MBA. Mr. Taylor is the Chief Executive Officer of the Company. Messrs McCracken, Malhotra, and Peters are independent of the Company, and 2. the Company's press release titled "Titan Mining Announces Phase III Metallurgy Results and Outlines Plans for Natural Flake Graphite Processing Facility in New York State", dated January 16, 2025, which was approved by Oliver Peters of Metpro Management Inc. Mr. Peters is a Qualified Person as defined by National Instrument 43-101 and is independent of Titan.


